Chandrayaan-1 Mission
Chandrayaan-1 ,India's first mission to the Moon was launched on 22 October 2008 using the Polar Satellite Launch Vehicle (PSLV-C11). The satellite made more than 3400 orbits around the Moon and the mission was concluded when the communication with the spacecraft was lost on 29 August 2009. The primary science objective of the mission was to prepare a three dimensional atlas of both near and far side of the Moon and to conduct chemical and mineralogical mapping of the entire lunar surface with high spatial resolution.
The most significant result from Chandrayaan-1 is the discovery of the presence of hydroxyl (OH) and water (H2O) molecules on the lunar surface. The inference of sub surface water-ice deposits in the base of craters in permanent sun shadow, detection of possible existence of water molecules in the lunar environment, validation of Lunar Magma Ocean hypothesis, detection of reflection of 20% of solar wind protons, detection of presence of Mg, Al, Si, Ca on the lunar surface and three dimensional conceptualization of many lunar craters of interest are other scientific results from Chandrayaan-1.
Successful realization of this mission has led to all round development in satellite technology, design, development and fabrication of a variety of experimental payloads, setting up communication, navigation and control system for going beyond the geostationary orbit, acquisition and transfer of data from lunar orbit through Indian Deep Space Network (IDSN) with 18-m and 32-m antennae to ground station network and establishment of Indian Space Science Data Centre (ISSDC) at Byalalu as the primary data center for Indian Space Science Missions.
Significant results from Chandrayaan-1
The major discovery of the Chandrayaan-1 mission is the detection of water (H2O) and hydroxyl (OH) on the lunar surface. The data also revealed their enhanced abundance towards the polar region.

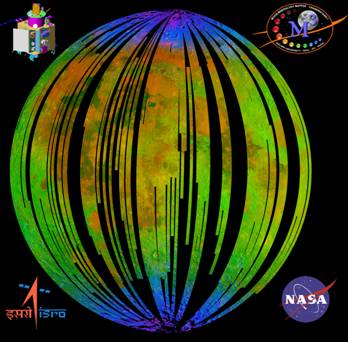
Fig.1 A three colour composite of near-infrared reflected solar radiation for the lunar nearside illustrating the spatial extent of diagnostic absorption measured by M3 is shown above. Blue colour indicates 3 micron absorption associated with presence of OH/H2O. Red indicates absorption at 2 micron due to the presence of iron-bearing minerals. The green represent reflected brightness at 2.4 micron. [Ref: Coverpage of Science, 23 Oct 2009 issue]

Fig.2 The reflectance spectra obtained by M3 (A)shows reduction of reflectance beyond 2.7 micrometer, this when compared with model near infrared reflectance spectra of H2O and OH applicable for lunar comparisons (B), indicate the presence of water and OH bearing materials on the lunar surface.[Ref: C.M.Pieters et al. Science, 326, 568-572, 2009]

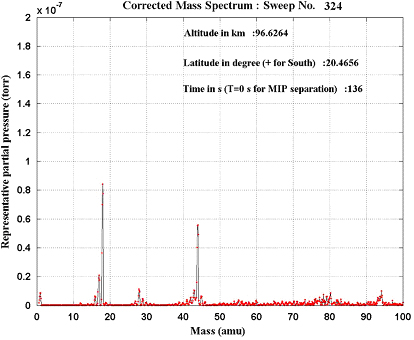
Fig.3 Sample mass spectrum corresponding to 97 km after the release of MIP highlighting the presence of H2O as the dominant species [Ref: Sridharan R et al. Planetary and Space Science (2010)]

Fig.4 Three-dimensional view of Apollo-15 landing site by TMC showing front of Apennine Mountain, parts of Rima Hadley Rille and ‘halo’ around the landing site of the Apollo-15 Lunar module. [Ref: Prakash Chauhan et al. Current Science, 97, 630-631, 2009]

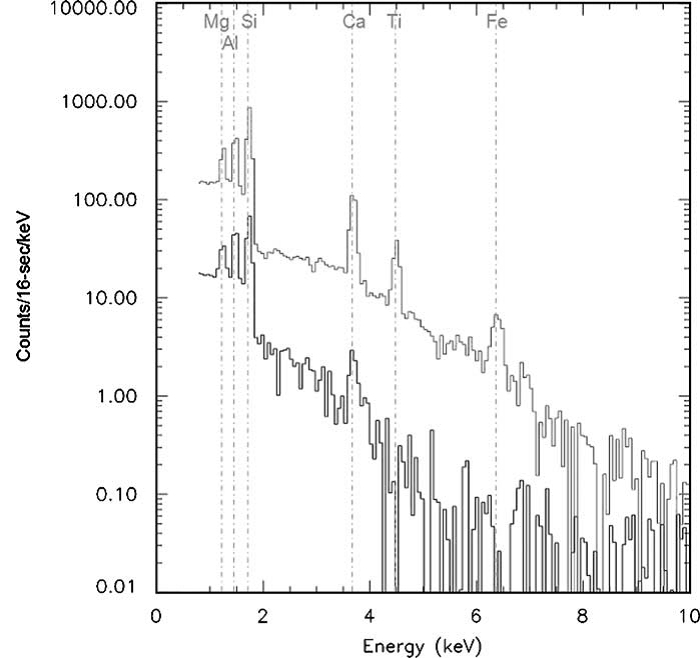
Fig.5 Simulated C1XS spectrum for the November 18 flare based on individual 16 s integrations. The lower line (black) shows the spectrum detected during the quiet period just before flare begins, while the upper line (grey) shows the spectrum obtained at the peak of the flare. [Ref: M. Grande et al. Planetary and Space Science, 57(2009)717–724]

Fig.6 Reflected hydrogen from lunar surface as detected by SARA [Ref: Martin Weiser et al. Planetary Space Science, 57, 2132-2134, 2009]
Related Links:
For more details about the mission and Results from Chandrayaan-1, visit Chandrayaan official website www.isro.gov.in/chandrayaan/
For Chandrayaan-1 Long term data archive, visit www.issdc.gov.in